Key takeaways
- Music is the most watched category on YouTube, exceeding 50% of viewers in every single age group. It is also the category people are least likely to look at.
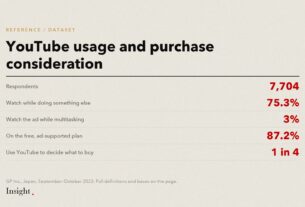
- 87.2% of viewers use the free, ad-supported plan. The ad-reachable audience is almost the entire audience.
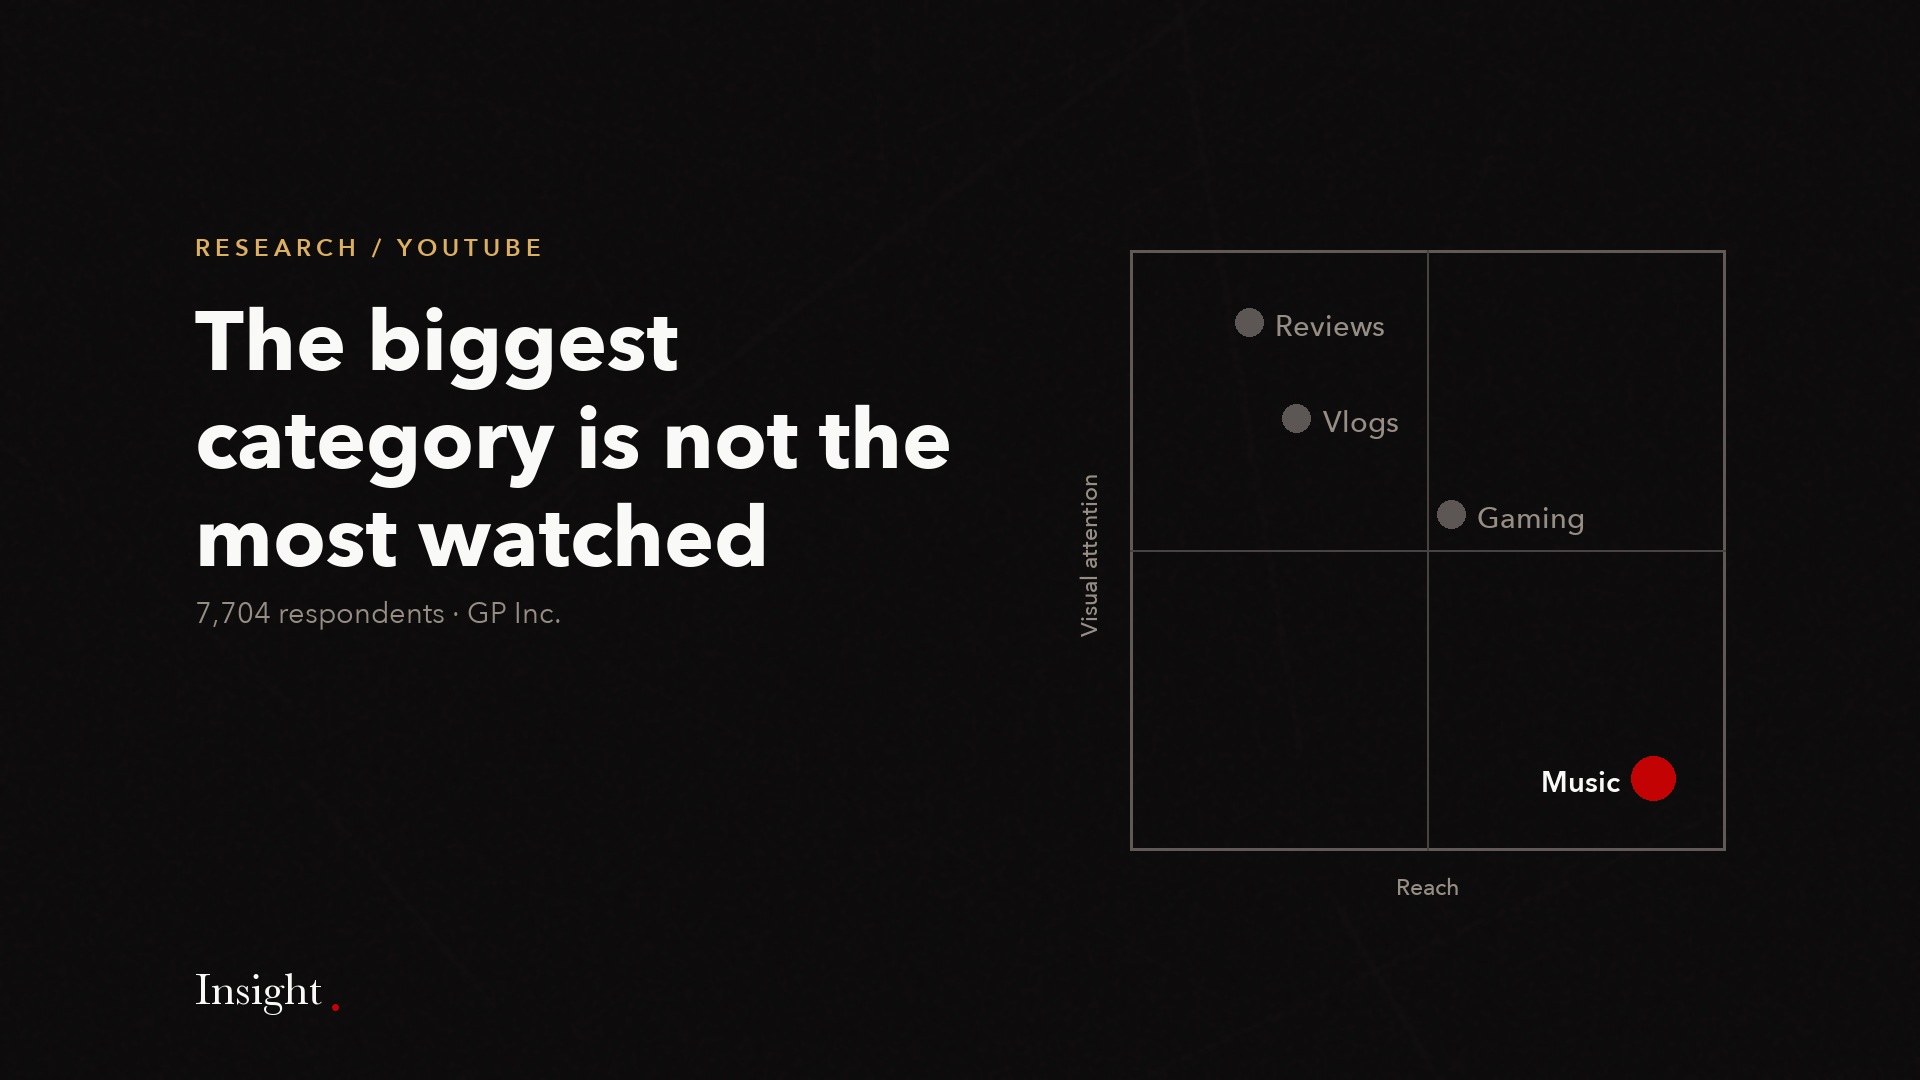
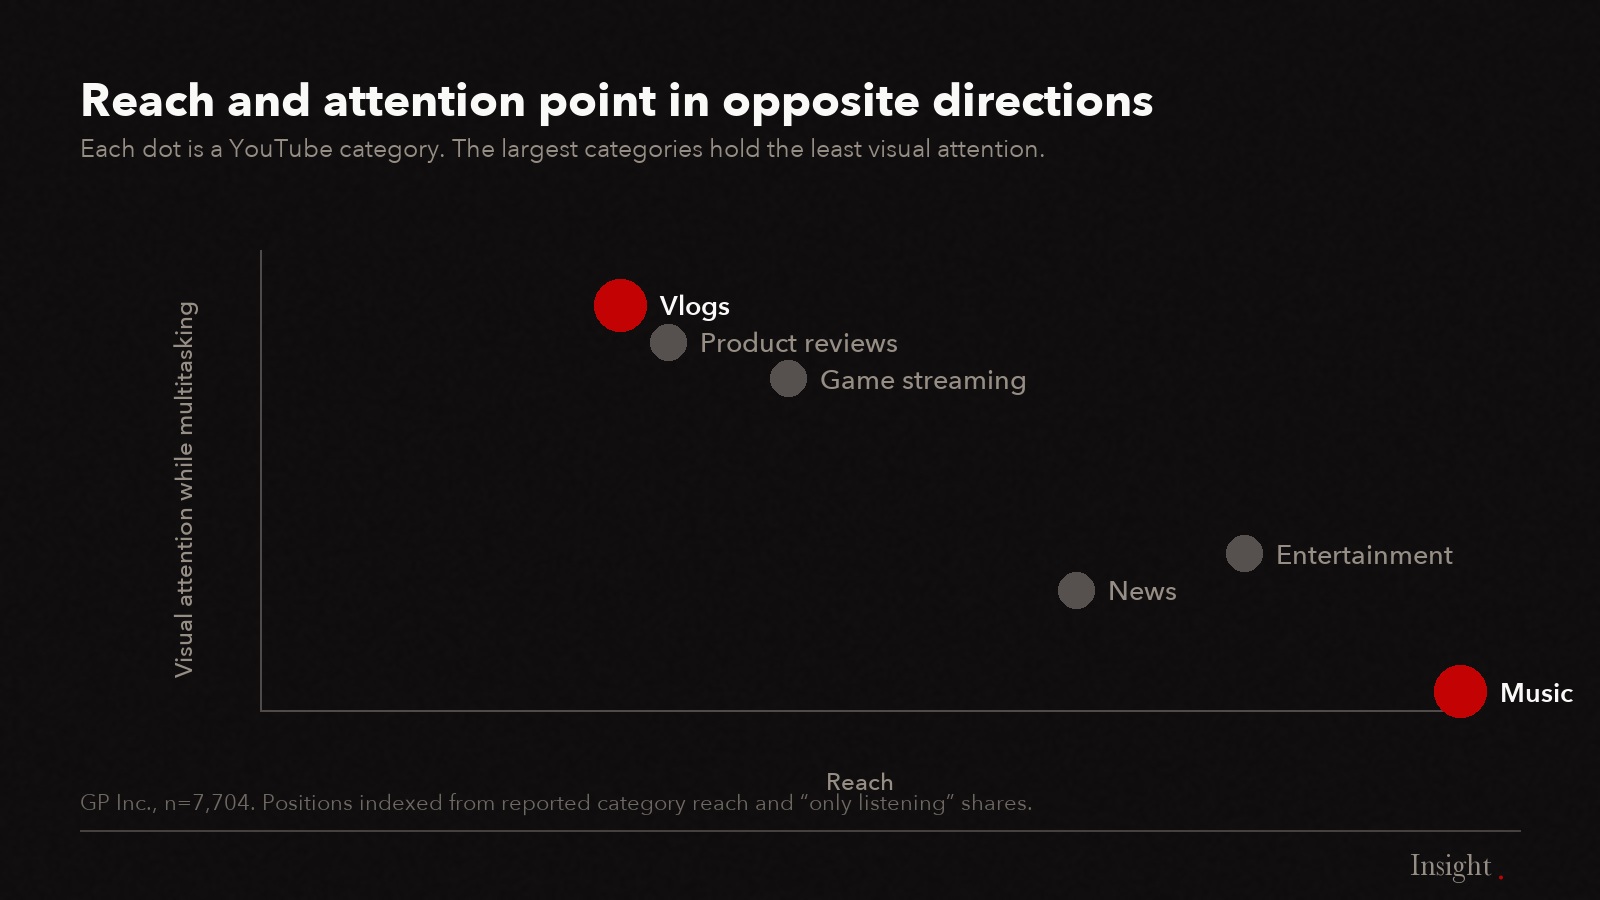
- The categories that hold visual attention — vlogs, product reviews, game streaming — are not the categories with the largest reach. Reach and attention point in opposite directions.
Planning YouTube by category usually starts from reach: find the largest category the target audience watches and buy it. Survey research by GP Inc., across 7,704 respondents, suggests that instinct leads directly to the least attentive inventory available. Here is what the category data actually shows.
What is the most watched category on YouTube?
Music, by a clear margin. 62.7% of respondents said they frequently watch music content, ahead of entertainment, sports and news. Music holds this position across every age segment measured, with more than 50% of viewers in each group naming it — a consistency no other category matches.
Entertainment ranks second across all age groups, helped by professional creator content and official broadcast clips. Game streaming performs strongly among viewers aged 15 to 39 and then declines sharply with age.
How do viewing habits differ by age and gender?
Less than category planning usually assumes, with two clear exceptions. Music leads in every age group and both genders. Game streaming and sports are watched around 1.5 times more by men, while vlogs and lifestyle content are watched around 1.5 times more by women. Age separates game streaming sharply and almost nothing else.
- Consistent across age: music (over 50% in every segment), entertainment.
- Falls sharply with age: game streaming, above average for 15–39 then declining.
- Skews male (about 1.5×): game streaming, sports.
- Skews female (about 1.5×): vlogs, lifestyle content such as pets, cooking and fitness.
Do most people pay to remove ads?
No. 87.2% of respondents do not subscribe to YouTube Premium and use the free plan, which includes advertising. Subscription concentrates among people in their twenties, where it reaches 38.4% of men and 28.4% of women, but across the whole population the ad-supported audience remains the overwhelming majority.
The planning implication runs against a common assumption. Advertisers sometimes discount YouTube on the basis that valuable audiences have bought their way out of advertising. On this evidence they have not, with one qualification: if a campaign targets people in their twenties specifically, roughly a third of that group is unreachable by advertising.
Which categories hold attention, and which are only background?
The largest categories hold the least attention. 66% of multitasking viewers play music in the background, and only about 2.5% focus on the screen during it. Vlogs are at the other end: roughly 20% of viewers still watch the screen even while multitasking, despite vlogs being a far smaller category.
| Category | Reach | Visual attention while multitasking |
|---|---|---|
| Music | Highest (62.7%) | Lowest — about 2.5% focus on screen; 36.5% do not look at all |
| News | High | Low — 21.2% listen without looking |
| Entertainment | High | Often played while multitasking, but harder to follow by audio alone |
| Vlogs | Smaller | Highest — around 20% still focus on the screen |
| Product reviews, game streaming | Smaller | High — among the strongest for focused attention |
This is the central tension in YouTube category planning. Buying for reach selects music and entertainment. Buying for attention selects vlogs, reviews and game streaming. The two strategies barely overlap, and the reported metrics will look better for the first one. We examine that measurement gap in the 3% problem.
How should categories be used in planning?
As a filter for attention, not a proxy for audience. Category tells you how likely someone is to be looking at the screen, which is a genuinely useful signal. It does not tell you who is watching or what they are in the market for — and it is too coarse to distinguish a tactical breakdown from a highlights reel inside the same category.
For that distinction you need to select at video level. Our analysis of World Cup content across five markets found the same category label covering completely different content and audiences, which we cover in five markets watched five different World Cups.
Frequently asked questions
What percentage of YouTube users see ads?
87.2% of respondents use the free plan and are therefore reachable by advertising. Premium subscription peaks among people in their twenties at 38.4% of men and 28.4% of women, so age-specific campaigns should account for a smaller reachable base in that group.
Is music the best category to advertise in on YouTube?
It is the largest, not the best. Music reaches more viewers than any other category but holds the least visual attention: only about 2.5% of multitasking viewers focus on the screen during music, and 36.5% do not look at it at all.
Which YouTube categories skew male or female?
Game streaming and sports are watched roughly 1.5 times more by men. Vlogs and lifestyle content such as pets, cooking and fitness are watched roughly 1.5 times more by women. Music and entertainment show little gender difference.
Does game streaming only reach young viewers?
Largely. Game streaming is above average among viewers aged 15 to 39 and declines sharply with age. It is one of the few categories where age is a strong predictor, which makes it useful for age-skewed campaigns and unhelpful for broad reach.
All figures from this research, with bases and definitions, are collected on the research data page.
Source: GP Inc., YouTube Usage and its Impact on Product Purchase Consideration. Online survey of 7,704 respondents aged 15 and over, conducted 28 September – 11 October 2023. Usage and subscription questions were asked of 6,603 respondents, category questions of 1,101, and multitasking behaviour of 800. Fieldwork was conducted in Japan; a separate study covering Taiwan is available below.
Get the full report. Taiwan edition (2025) · Korea edition
Choosing environments, not just categories. GP filters low-attention placements and targets high-engagement content. Talk to your local team.