A reference page for the figures cited across our YouTube research. Updated when new market editions are released. For the analysis behind these numbers, see the linked articles.
What this report measures
How people actually use YouTube, how much attention advertising receives in that context, and how far the platform influences purchase decisions. The study covers viewing frequency, subscription status, category preference, multitasking behaviour, response to advertising, and the role of YouTube in shopping.
- Researcher: GP Inc.
- Method: Online survey
- Respondents: Ages 15 and over
- Period: 28 September – 11 October 2023
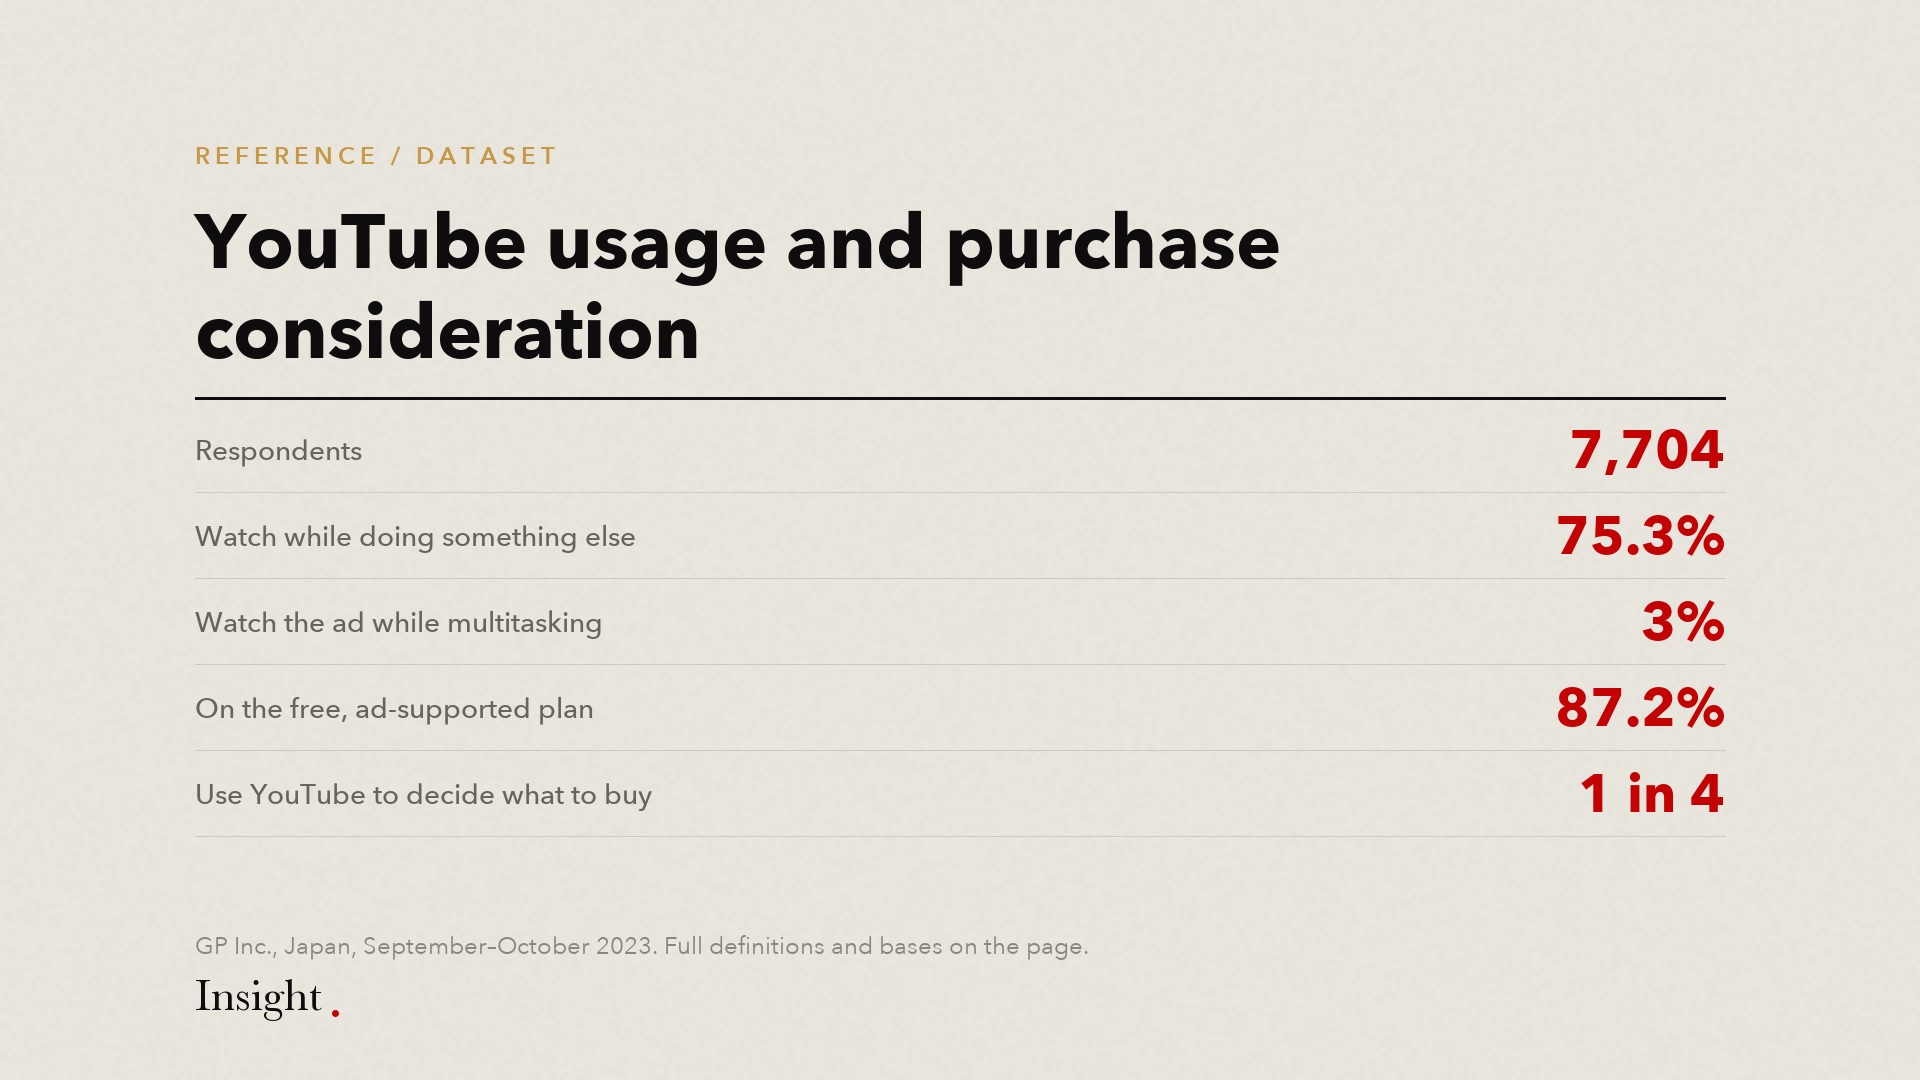
- Unique sample: 7,704
- Market: Japan (a separate 2025 edition covers Taiwan)
- Last updated: 2026-08-21
Key findings
- Reported view rates of 40–50% coexist with only 3% of multitasking viewers actually watching the advertisement.
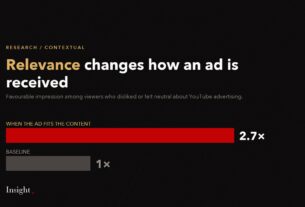
- Contextual relevance raises favourable impression of advertising by approximately 2.7 times among previously negative or neutral viewers.
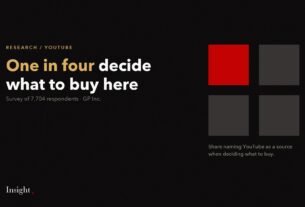
- One in four people use YouTube as an information source when deciding what to buy.
Usage and reach
73% of respondents use YouTube at least once a week. 87.2% use the free, ad-supported plan rather than YouTube Premium, so nearly the entire audience is reachable by advertising. Premium subscription is concentrated among people in their twenties, at 38.4% of men and 28.4% of women in that group.
| Measure | Value | Base |
|---|---|---|
| Use YouTube at least weekly | 73% | 6,603 |
| Do not subscribe to Premium | 87.2% | 6,603 |
| Premium subscription, men in their 20s | 38.4% | 6,603 |
| Premium subscription, women in their 20s | 28.4% | 6,603 |
Categories and attention
Music is the most watched category at 62.7%, and holds that position in every age segment measured. It is also the category least likely to be looked at: 66% of multitasking viewers play it in the background, and only about 2.5% focus on the screen during it.
| Measure | Value | Base |
|---|---|---|
| Frequently watch music content | 62.7% | 1,101 |
| Play music in background while multitasking | 66% | 800 |
| Do not look at screen during music | 36.5% | 800 |
| Do not look at screen during news | 21.2% | 800 |
| Focus on screen during music while multitasking | about 2.5% | 800 |
| Focus on screen during vlogs while multitasking | about 20% | 800 |
Analysis: The biggest YouTube category is the one nobody watches.
Multitasking and advertising response
75.3% of respondents watch YouTube while doing something else. Among those viewers, 96.9% respond to advertising in ways that generate no advertising value: roughly 70% skip, and 22% let the ad run because skipping is more effort than ignoring it.
| Measure | Value | Base |
|---|---|---|
| Watch while multitasking (always / frequently / sometimes) | 75.3% | 1,101 |
| Reported view rate, campaign interfaces | 40–50% | — |
| Actually watch ads while multitasking | 3% | 800 |
| Respond in ways producing no advertising value | 96.9% | 800 |
| — skip the ad | about 70% | 800 |
| — let it run because skipping is a hassle | 22% | 800 |
Analysis: The 3% problem.
Contextual relevance
Respondents who said they disliked or felt neutral about YouTube advertising were asked whether their impression changes when the ad is highly relevant to the video they are watching. Favourable impression rose by approximately 2.7 times within that group.
| Measure | Value | Base |
|---|---|---|
| Increase in favourable impression with contextual relevance | about 2.7× | 979 |
| General impression of YouTube advertising | — | 1,101 |
Analysis: Contextual ads are received 2.7x better.
Purchase consideration
One in four respondents use YouTube as an information source when shopping, making it the most used online media for purchase inspiration in this study. Its influence is strongest for games, daily necessities and cosmetics, where it leads all online media.
| Measure | Value | Base |
|---|---|---|
| Use YouTube as a purchase information source | 1 in 4 | 1,101 |
| Categories where YouTube leads all online media | Games, daily necessities, cosmetics | 1,101 |
Analysis: One in four people use YouTube to decide what to buy.
Method and definitions
- Multitasking viewing: watching while doing at least one other activity at the same time.
- Contextual advertising: targeting based on the keywords and content of the page or video, rather than on the behaviour of the individual viewer.
- Favourable impression: respondents answering “like” or “somewhat like”.
- Varying bases: not every question was asked of the full sample. Bases are stated with each figure above and range from 800 to 7,704.
- Reported view rate is the range commonly shown in campaign interfaces, included for comparison; it is not a survey result.
How to cite this report
GP Inc., “YouTube Usage and its Impact on Product Purchase Consideration”, 2023. Published by Insight at FreakOut. https://insight.freakout.net/youtube-usage-research/
These figures may be quoted with attribution to GP Inc. and a link to this page. Please state the base alongside any percentage you reproduce.
Frequently asked questions
Who conducted this research?
GP Inc., which develops contextual intelligence for YouTube advertising and is part of the FreakOut group. The study was run as an online survey of 7,704 respondents aged 15 and over between 28 September and 11 October 2023.
Which markets does this cover?
This edition covers Japan. A separate 2025 study covering Taiwan, with more than 1,700 respondents aged 15 and over, follows a similar structure and is available for download. A Korea edition is also available.
Why do the bases differ between figures?
Questions were asked of different subsets. Usage and subscription were asked of 6,603 respondents, category and multitasking incidence of 1,101, multitasking behaviour of 800, and the contextual relevance follow-up of the 979 who were not already positive about advertising.
How often is this updated?
This page is revised when a new market edition is published. The date of the most recent revision is shown at the top, and material changes are listed in the update history below.
Update history
- 2026-08-21 — Page created. Figures from the 2023 edition; links added to the Taiwan (2025) and Korea editions.
Download the full report. Taiwan edition (2025) · Korea edition
Apply this to a campaign. GP targets high-attention, contextually relevant placements on YouTube. Talk to your local team.