
Key findings
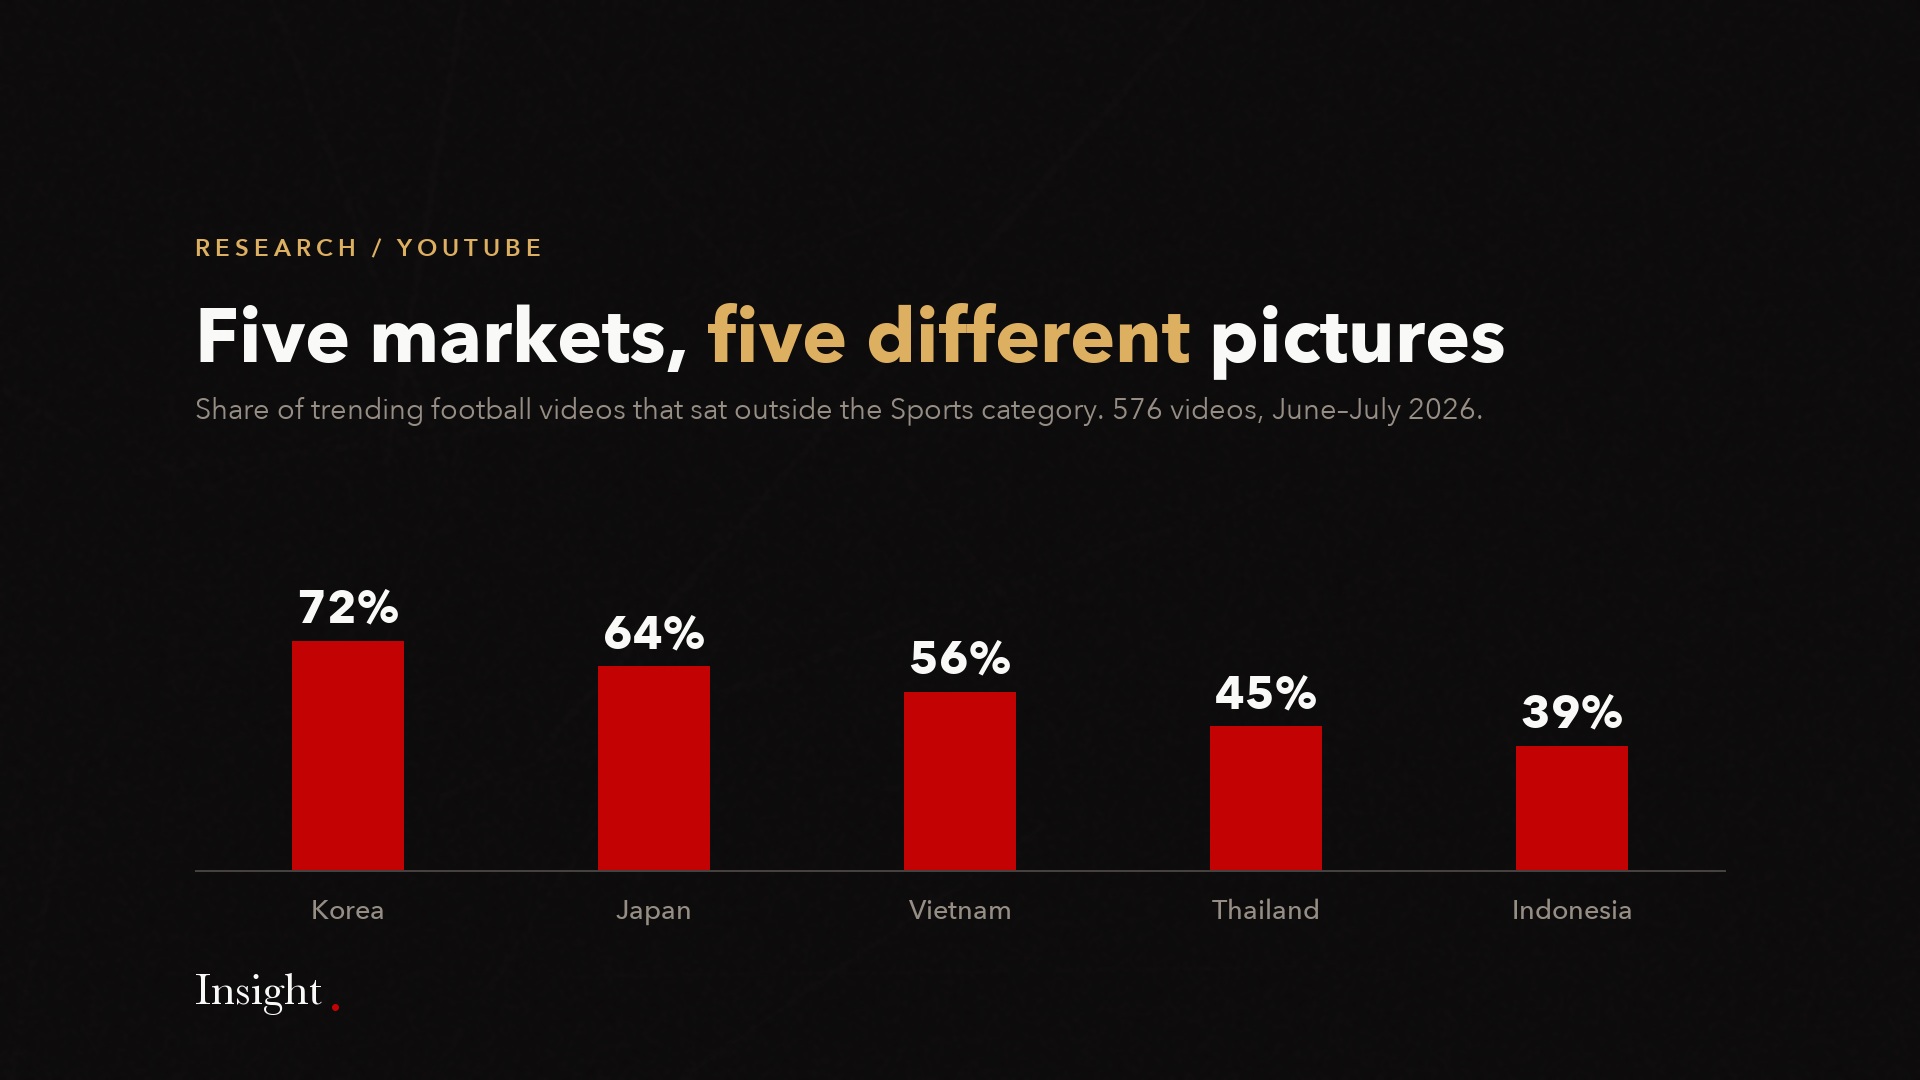
- Sports accounted for 27% to 60% of the trending football videos, depending on the market. In every market the majority or near-majority sat in other categories.
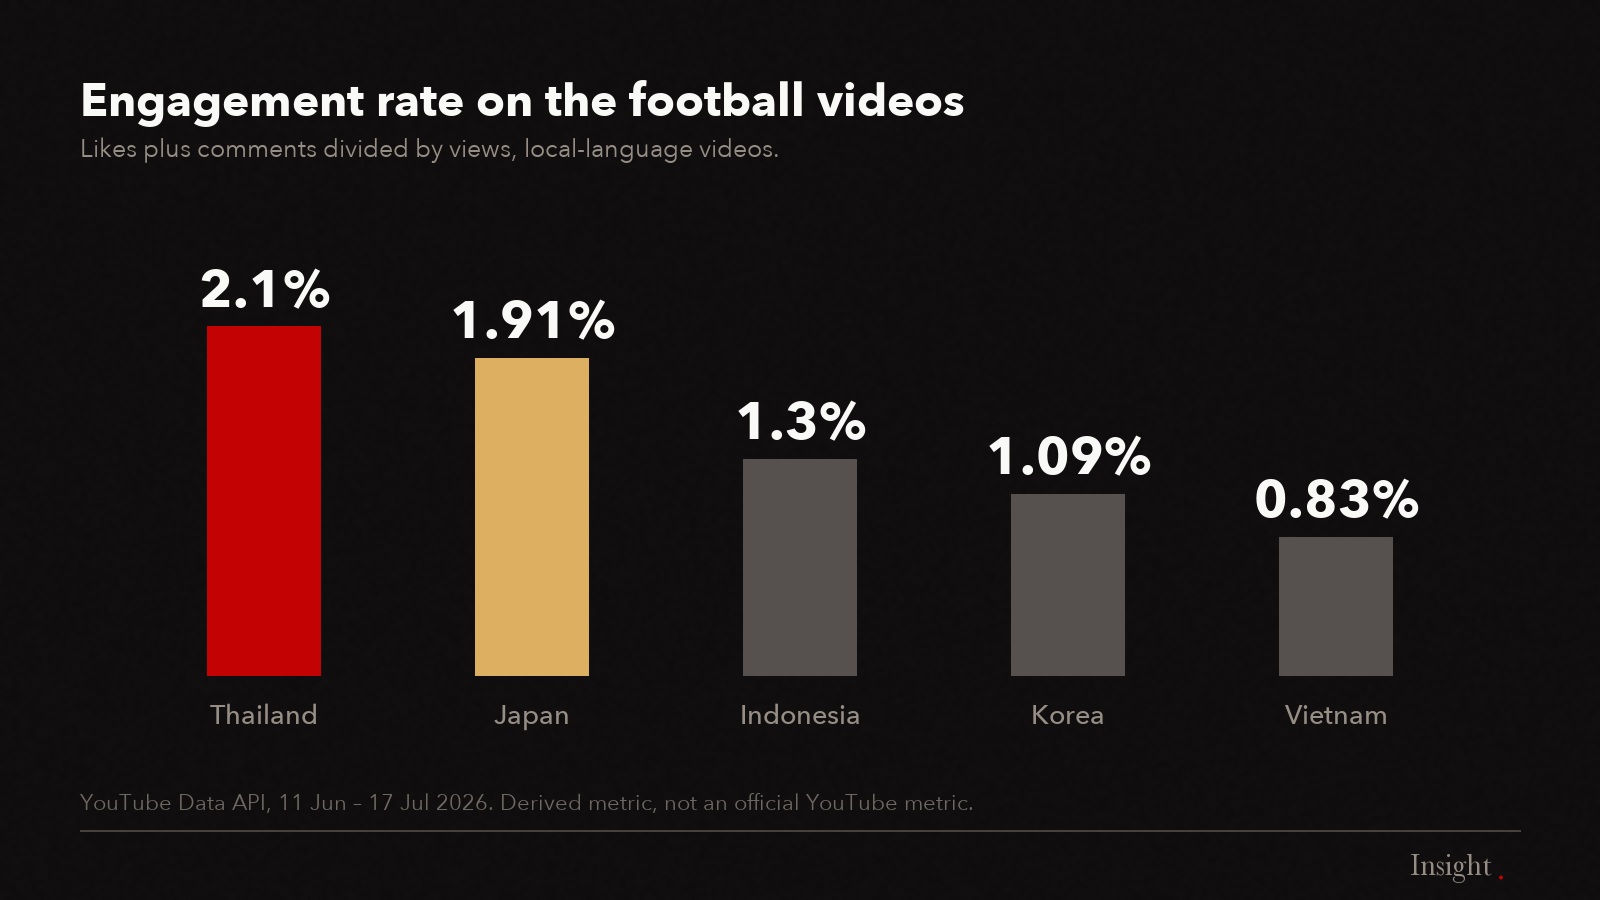
- Engagement rate ranged from 2.10% in Thailand to 0.83% in Vietnam. Vietnam produced the most trending videos and the lowest engagement rate.
- No team or player led across all markets. Haaland drew more mentions than Messi in Taiwan; Ronaldo drew 2.7 times more than Messi in the Philippines.
- No local-language videos on this subject trended in the Philippines. All 78 recorded there were in English.
We tracked every local-language football video related to the men’s international tournament of June–July 2026 that entered YouTube’s most-popular chart across five Asian markets, and analysed the comments on them. This page reports the measurements. The method and its limits are stated at the end.
How many of these videos trended in each market?
627 unique videos entered the chart across the five markets. Metrics below are based on the 576 still retrievable when figures were collected after the tournament. Vietnam produced the most, Thailand the fewest.
| Market | Videos measured | Engagement rate | Mean days on chart |
|---|---|---|---|
| Vietnam | 142 | 0.83% | 4.9 |
| Japan | 135 | 1.91% | 7.2 |
| Indonesia | 119 | 1.30% | 6.0 |
| Korea | 93 | 1.09% | 6.6 |
| Thailand | 87 | 2.10% | 5.6 |
Volume and engagement rank the markets in opposite orders. Vietnam is first on volume and last on engagement rate; Thailand is last on volume and first on engagement rate.
Which categories did the videos fall into?
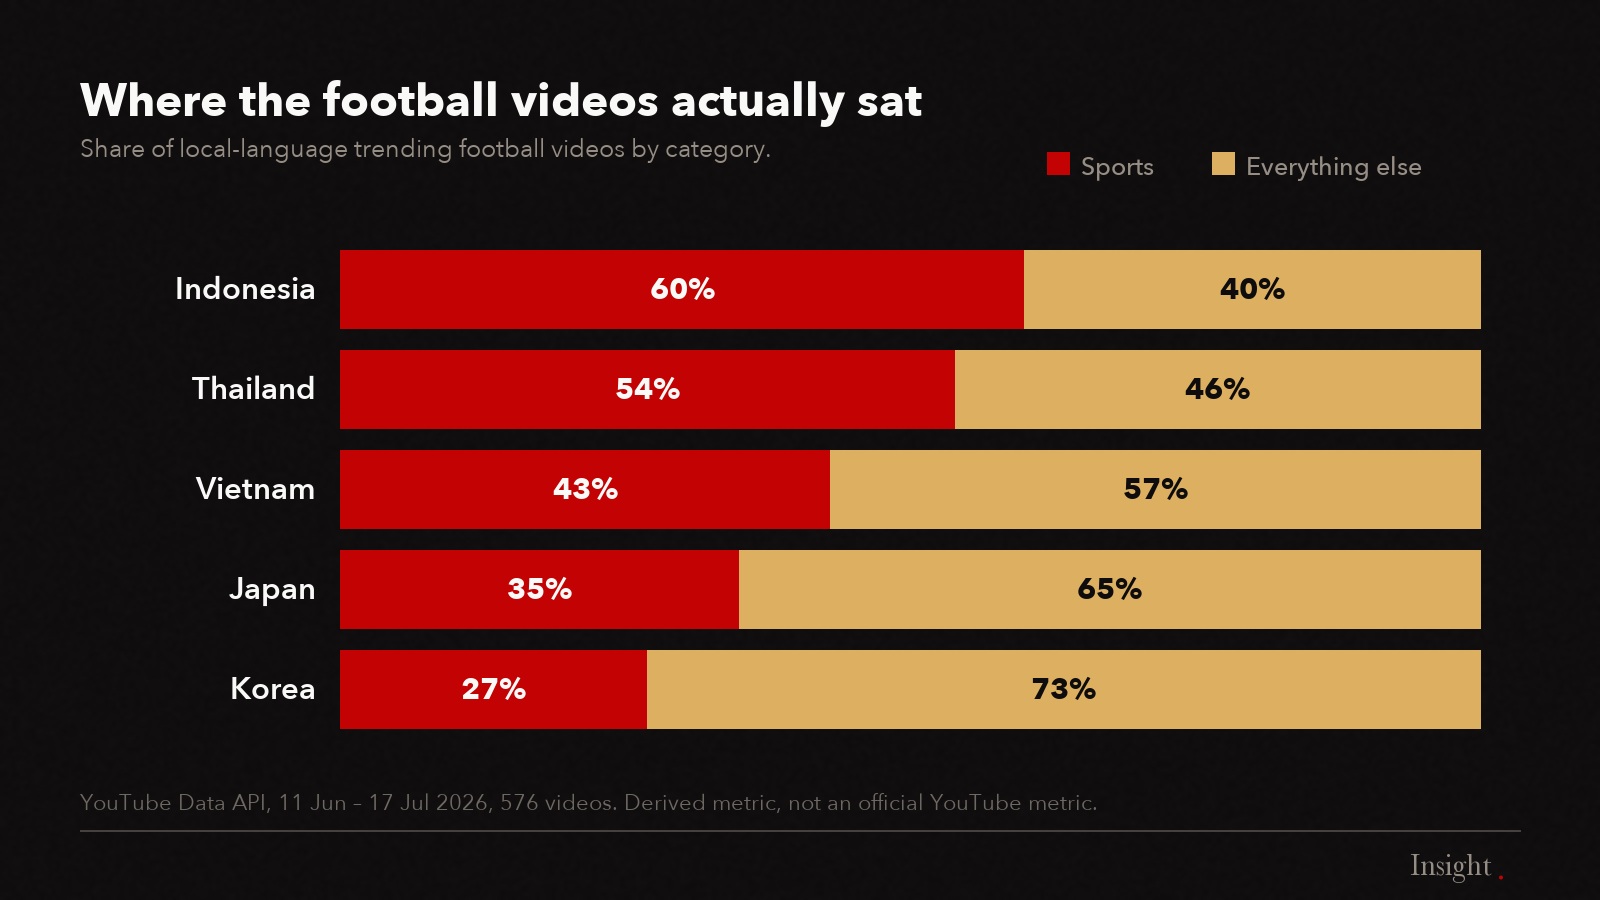
Sports was the largest category in every market, but its share varied by 33 percentage points: 60% in Indonesia against 27% in Korea. The second-largest category differed by market.
| Market | Sports | Outside Sports | Second-largest category |
|---|---|---|---|
| Indonesia | 60% | 39% | People & Blogs (20%) |
| Thailand | 54% | 45% | People & Blogs (29%) |
| Vietnam | 43% | 56% | Entertainment (23%) |
| Japan | 35% | 64% | People & Blogs (31%) |
| Korea | 27% | 72% | People & Blogs (27%) |
Stated as a planning figure: a buy restricted to the Sports category would not have covered between 39% and 72% of the trending football videos in these markets.
Which teams were discussed most?
Argentina led in Indonesia, Vietnam and Taiwan. Thailand led with England and the Philippines with Brazil. Mention counts differ by two orders of magnitude between markets, reflecting differences in the comment volume analysed.
| Market | 1st | 2nd | 3rd |
|---|---|---|---|
| Indonesia | Argentina (17,880) | Spain (7,045) | Brazil (6,782) |
| Taiwan | Argentina (30,112) | Spain (17,092) | Norway (13,472) |
| Vietnam | Argentina (818) | France (703) | Spain (577) |
| Thailand | England (2,764) | Spain (2,517) | Brazil (1,927) |
| Philippines | Brazil (6,015) | Portugal (2,998) | Argentina (1,964) |
Which players were discussed most?
Messi led in Indonesia and Thailand. Ronaldo led in Vietnam and the Philippines, where he drew 2.7 times more mentions than Messi. In Taiwan neither led: Haaland took first place with 21,348 mentions against Messi’s 14,316.
| Market | 1st | 2nd | 3rd |
|---|---|---|---|
| Indonesia | Messi (11,437) | Ronaldo (8,314) | Mbappé (1,874) |
| Philippines | Ronaldo (21,142) | Messi (7,750) | Neymar (1,139) |
| Taiwan | Haaland (21,348) | Messi (14,316) | Mbappé (3,339) |
| Thailand | Messi (3,770) | Ronaldo (2,844) | Haaland (483) |
| Vietnam | Ronaldo (2,557) | Messi (1,603) | Neymar (381) |
What were the highest-engagement videos?
We ranked the top three videos by engagement rate in four markets. The highest single rate recorded was 11.84%, in Indonesia. In none of the four markets did a match highlight or result video appear in the top three.
| Market | Top 3 engagement rates | Subject of the top video |
|---|---|---|
| Indonesia | 11.84% / 10.95% / 9.58% | Interactive poll on supporters’ face paint |
| Thailand | 9.34% / 5.86% / 5.66% | Suárez biting incident, as a meme |
| Philippines | 9.25% / 9.12% / 8.90% | Creator sketch featuring Haaland |
| Vietnam | 3.76% / 3.38% / 2.62% | Creator reaction to Ronaldo leaving the pitch |
The recurring subjects across these twelve videos were creator-produced content, memes and off-pitch storylines. Two of Thailand’s top three concerned a Ghanaian shaman’s predictions about players.
Who published the trending videos?
The most frequent publishers differed by market. Broadcasters led in Vietnam and Indonesia; an individual creator led in Japan, ahead of DAZN Japan; a sports streaming service led in Thailand; a news broadcaster led in Korea.
| Market | Most frequent channels (videos on chart) |
|---|---|
| Vietnam | TVAd TV (18), VTV Thể Thao (13), VTV Nam Bộ (13) |
| Indonesia | FolaPlay (17), TVRI Nasional (15), Revisi Terakhir (11) |
| Thailand | Monomax Sports (24), Ball Talk Thailand (10) |
| Japan | Individual football creator (12), DAZN Japan (11) |
| Korea | KBS News (10) |
Why is the Philippines reported separately?
No local-language videos on this subject entered the chart there. All 78 recorded in the Philippines were in English, and the top three by engagement were creator-produced sketches rather than broadcast or match content. The Philippines is therefore excluded from the five-market category and volume comparisons above.
What does this mean for planning?
Category-level buying does not track a cultural moment reliably. During this period the relevant content sat across Sports, People & Blogs, Entertainment and News & Politics simultaneously, in proportions that changed by market. Selecting at video level covers that distribution; selecting at category level does not.
Related: contextual advertising on premium publishers and the 3% problem.
Frequently asked questions
Which market had the highest engagement on this content?
Thailand, at 2.10% on local-language football videos, ahead of Japan at 1.91%. Vietnam recorded the most trending videos, 142, and the lowest engagement rate at 0.83%.
Between 27% and 60%, depending on the market: Indonesia 60%, Thailand 54%, Vietnam 43%, Japan 35%, Korea 27%. The remainder sat mainly in People & Blogs, Entertainment and News & Politics.
How long did a video stay on the trending chart?
Between 4.9 and 7.2 days on average, by market: Japan 7.2, Korea 6.6, Indonesia 6.0, Thailand 5.6, Vietnam 4.9. The longest single video appeared on 24 separate days.
Why are the Philippines figures reported separately?
Because no local-language videos on this subject trended there. The five-market comparison covers local-language videos only, so the Philippines could not be included on the same basis. Its 78 English-language videos and 193,078 comments are reported on their own.
Method
Videos were collected daily from the YouTube Data API using the most-popular chart for each market, from 11 June to 17 July 2026, then deduplicated across days. The set was filtered to videos in the local language whose titles referenced the tournament; eSports and video-game content was excluded.
- Two counts, two definitions. 627 unique videos entered the chart across the five markets. View and engagement figures are based on the 576 still retrievable when metrics were collected after the tournament; 51 had been deleted or made private in the interim.
- Engagement rate = (likes + comments) ÷ views, calculated by FreakOut.
- Comment analysis covers 206,093 Indonesian, 193,078 English (Philippines), 64,516 Thai, 35,431 Vietnamese and 15,957 Chinese (Taiwan) comments. Japan and Korea were not included in the comment analysis.
- Chart tenure is the number of daily snapshots in which a video appeared, not continuous days.
- Categories are as assigned by YouTube, not reclassified by us.
- Limits. Top-three engagement rankings were produced for four markets only. Comment mention counts are not comparable across markets because the bases differ.
This is an independent analysis of publicly available YouTube data. FreakOut has no affiliation with, and this study is not endorsed by, any tournament organiser, governing body, broadcaster or team. Competitor, team and player names appear only as they occurred in the public comment data analysed.
Source: YouTube Data API, collected 11 June – 17 July 2026, with metrics re-collected in July 2026. Engagement rate, category shares and chart tenure are derived metrics calculated by FreakOut and are not official YouTube metrics. This is an ad-hoc analysis rather than an automated report. All figures are point-in-time snapshots and will differ from current values.Selecting at video level, not category level. GP analyses individual videos to place advertising in the content an audience is watching. Talk to your local team.